What You Need to Know About Google Shopping Insights
Google Shopping Insight is a tool released by Google to calculate customer interest in products, at either a national, regional, or city (metropolitan) scale using Google. It compares and contrasts customer demands and search trends for items over a period of time across different geographical boundaries and even devices’ perspectives.
Why Google Shopping Insights?
Why is this important for a business owners? Pointedly, the data from Google Insights, when reviewed by businesses, can help them to understand consumer shopping trends in their locale, and generate concepts and models for campaigns toward specific target audiences through the data and intelligence available in this tool. In summary, Shopping Insights helps you to comprehend trends of products within your locale (assuming you own a business there) or specified regions.
How does it work and what can I search for using Google Insights?
Google feeds the Insights tool with data based on queries originating from Google.com and Google.com/Shopping. The data is aggregated with focus on a particular item based on an extensive sample of queries for that item, while factoring in the probability that different search terms or different keywords can be used describe the same item.
In the current version of this tool, you can conduct your search by product name or brand names. You should, however, note that Google Shopping Insights focuses on interest levels in products, and not keywords; therefore, each product or brand is represented using only one keyword. Shopping Insights focuses greatly on retailers with physical stores because, according to statistics, a lot of goods and items are still sold in stores.
Any limitations?
- Currently, the data available covers search queries from April 1, 2014, and it is for U.S.-based markets only.
- It is limited to city level data for about sixteen thousand (16,000) cities in the U.S.
- The data has been normalized at a range of 1-100. This is supposedly for easier comparative analysis, and the numbers certainly do not reflect the absolute search volume.
- You are also limited to products permitted by the Google Shopping policy.
- Google Shopping Insights isn’t particularly accommodating to product merchants of items considered to be in a moderate niche and yet which are still requested by customers.
What else do I need to know?
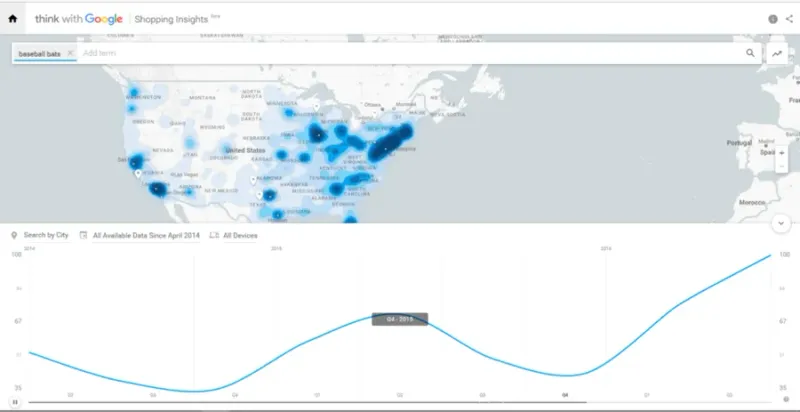
There are some interesting features you might want to explore in Insights. For example the heat map shows the popularity of an item in a specified timeframe across different areas. If you see darker shades of color, this shows a higher interest level in the item or items. Note that the data on the map is relative to the city with the highest interest, which is always 100. Of course, when you zoom in on the map, you can see more granular information for different states and cities. This happens until each exclusive city is visible as a circle. Hovering on the circle shows you the interest level in a city, relative to the city with the highest interest level.
Also of ardent interest is the time series graph, which shows the interest in an item across specified time frames, and which is intoned as a percentage of the highest point on the graph, that, as earlier stated, is fixed at 100.
If you so desire, you can filter your information by device: i.e., the ratio of interest by mobile device or smart phone users, compared to desktop or laptop devices. You can also compare two or more products, and you should know that the data is normalized against the highest point for the chart under review.
According to Google, top products are calculated as the ten products with the highest query volume for a particular month, and this is featured in descending order. Trending products are computed by comparing the query volume for the featured month to the preceding month, and is sorted by the highest volume of change.
Google Insight will definitely be useful for many business owners who can appreciate the powerful insights provided by aggregated data to show product trends and popularity. A product marketer can also use the data provided by the tool to target AdWords.
What is next?
As expected, Google promises fresh updates to Shopping Insights; however, if you are an online retailer and use tools like Magento eCommerce Store to drive your eCommerce business, and you would like to have insights about your existing business, you will be pleased to know that there are quite a number of helpful tools, add-ons, and extensions that can help you to manage your customers, inventory orders, marketing campaigns, and online business effectively.
A leading tool in this category is aheadWorks Market Segmentation Suite (no longer available). The Market Segmentation Suite Magento extension lets you easily segment your customers and orders by any number of custom criteria, such as order/shopping cart details, product, and customer personal information. You just need to create a segmentation rule and apply it to separate customer and order grids added by the module in your admin panel.
As a matter of fact, the list of customers/orders obtained after segmentation can be saved and used later to cultivate customized marketing programs and allocate marketing resources to best effect. For example, you can segment customers from the U.S. who have spent a certain amount (or more) and viewed a product more than two times, or segment customers from a specific zip code with a shopping cart value less than a certain amount who have viewed a certain item.
