Performance monitoring via Blackfire.io
Blackfire.io is one of the best profiling tools out there. It's easy to install, safe to have it in production and secure. We have been using it for a while to do adhoc performance fixes.
===Recently we decided to dig deeper into the extra features. The concept of "performance as a feature" caught our attention. In a nutshell, performance should be part of testing, each deployment should make sure that the application still performs decently. This should be tested automatically part of the build process, so Blackfire comes to the rescue with a way to run profiles that check for key performance metrics, like used RAM, processor, SQL queries etc. Thresholds can be defined and the team can get alerts if certain limits are hit.
Our use case concerned the dev servers - we wanted to check nightly that the newly introduced code does not break performance. This article will present a step by step process to accomplish this. It assumes that you already can run adhoc profiles. If this is not the case, https://blackfire.io/docs/up-and-running/installation is a good place to start.
Setting up an environment
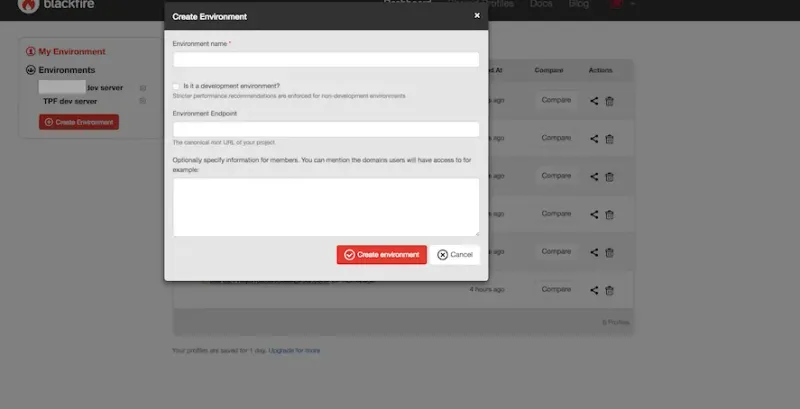
For each site you want to monitor, you need to create a new Environment in Blackfire:
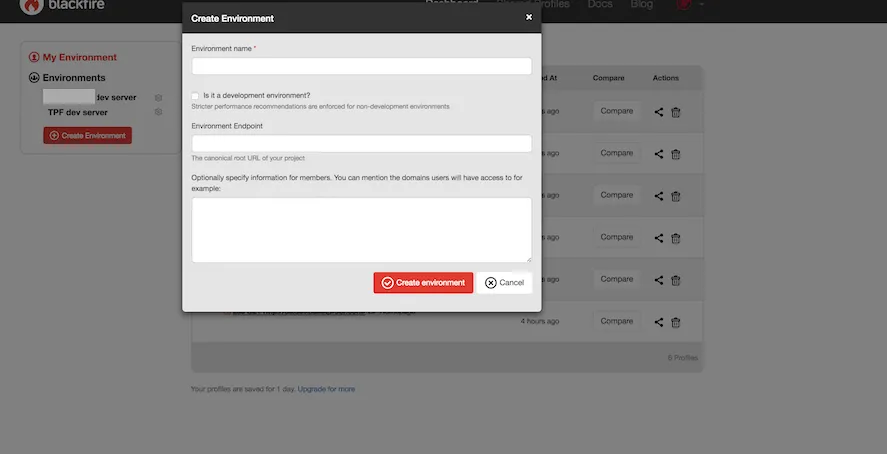
The relevant settings here are:
* Environment name, i.e. FooBar
* Is it a development environment? Leave unchecked
* Environment end point. The base url, i.e. http://example.com/
Note that the url must be accessible from the outside (DNS must be set). It is fine to have http authentication.
Click on the newly created env and take note of the generated Server ID and server token credentials:
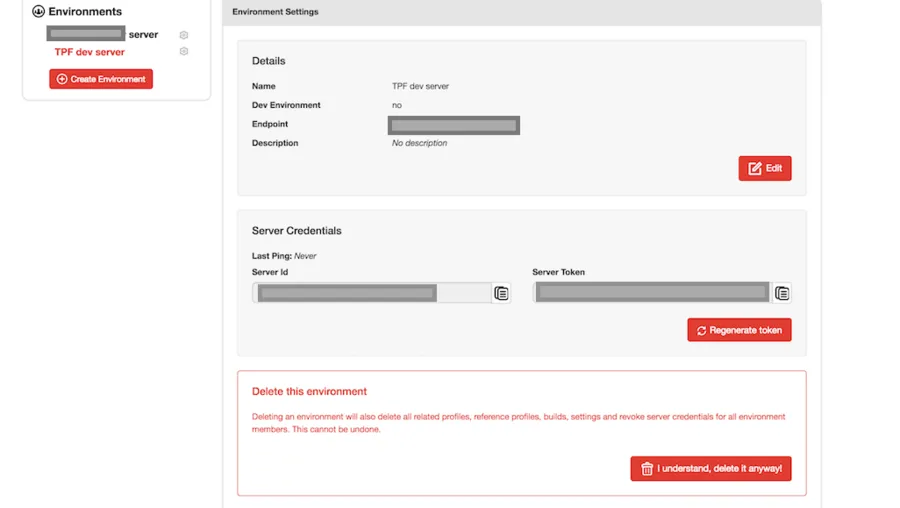
Login to the dev server and find the vhost file, i.e. /etc/apache2/sites-enabled/dev.example.com.conf . Add the following lines inside the <Directory> directive, adding the correct credentials:
php_admin_value blackfire.server_id "XXXXXXXXXXXXX"
php_admin_value blackfire.server_token "YYYYYYYYYY"
Restart Apache and you are all set, the site should be communicating with the correct environment.
Thinking about what you want to measure
Blackfire can profile a set of urls. Think about the main pages you care about. For example, you might want to profile the home, category and product detail pages. Simply grab a url for each, i.e.:
- http://dev.example.com/
- http://dev.example.com/coffee-drinks/coffee/
- http://dev.example.com/coffee-whole-bean-12oz
Now, given those pages, you need to think what you want to measure. The full list of supported metrics is at https://blackfire.io/docs/reference-guide/metrics . For example, I have chosen:
- metrics.sql.queries.count
- main.wall_time
- main.memory
So number of SQL queries, page load time and used memory.
Next step is defining the thresholds. Keep in mind that we want to get alerted when the performance decreases, but the decrease depends on the current values, which differ for each project. Profile each page manually and see the current metrics. For example, I got:
| Page Type | Sql query number | Wall time | Memory |
|---|---|---|---|
| Category page | 222 | 3.56s | 39.2MB |
| Home page | 40 | 1.58s | 24.2MB |
| Product page | 208 | 4.11s | 53MB |
The yaml file
To have Blackfire check for your metrics and pages, a .blackfire.yaml file must be created in the project's webroot, i.e. http://dev.example.com/.blackfire.yml . https://blackfire.io/docs/cookbooks/tests is a good place to start understanding the file and https://blackfire.io/docs/validator is a validator to make sure you have got the syntax right. Per our examples, the following .blackfire.yaml file was created:
tests:
  "Homepage baseline":
    path: "/"
    assertions:
      - "main.wall_time < 2.5s"
      - "main.memory < 40MB"
      - "metrics.sql.queries.count < 50"
  "Category page baseline":
    path: ".*coffee-drinks/coffee.*"
    assertions:
      - "main.wall_time < 5s"
      - "main.memory < 80MB"
      - "metrics.sql.queries.count < 250"
  "Product page baseline":
    path: ".*coffee-whole-bean-12oz.*"
    assertions:
      - "main.wall_time < 5s"
      - "main.memory < 80MB"
      - "metrics.sql.queries.count < 250"
scenarios:
  Home page:
    - path: /
  Category page:
    - path: /coffee-drinks/coffee/
  Product detail page:
    - path: /coffee-whole-bean-12oz
The tests section simply defines the URLs to check (mind that they are relative and you can use wildcards). You cannot use GET parameters in the URLs (they are ignored). The metrics are consistent with our findings and define the values for which no alert will be triggered. The scenarios section simply lists the actual (relative) URLs Blackfire will visit & profile nightly.
Setting up the trigger
Back in the Blackfire admin screen, click on the settings (gear icon) for your environment, click triggers and navigate to "Webhook":
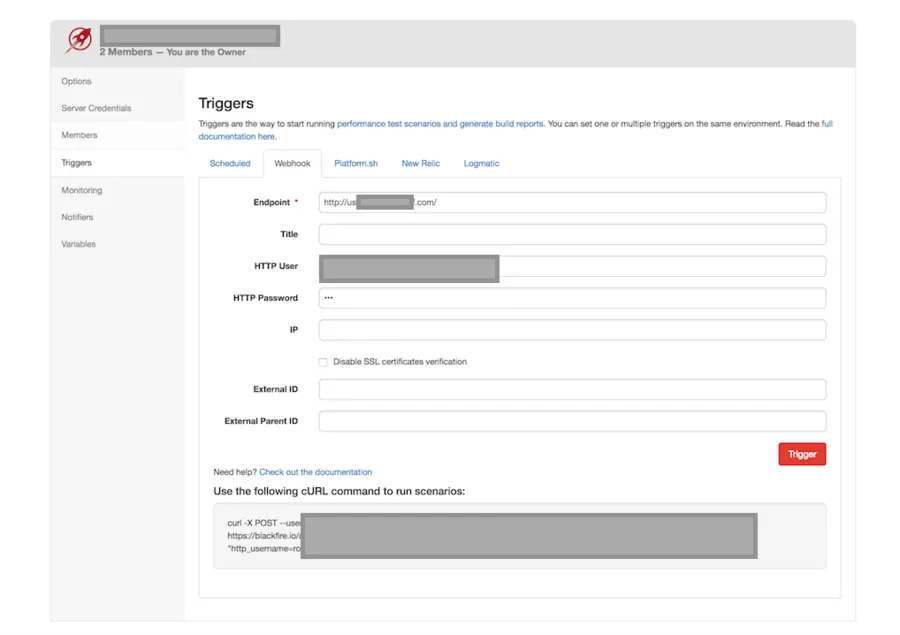
The important values here are:
- Endpoint - the base url of the site
- HTTP user & HTTP password, in case you use HTTP authentication
- Disable SSL verification might be needed if you are testing a self-signed https site
Clicking "Trigger" should trigger a build. Make sure that all the urls are visited and that your assertions pass.
If all good, see the CURL command in the above screen (you will get a different one based on settings). Simply copy it and add a cron entry on dev:
1 1 * * * curl -X POST --user "XXXXXXXXX" https://blackfire.io/api/v1/build/env/YYYYYYYYYYY/webhook -d "endpoint=http://dev.example.com/" -d "http_username=foo" -d "http_password=bar" >/dev/null 2>&1
The above will trigger a build at 1:01 AM each night.
Setting up notifications
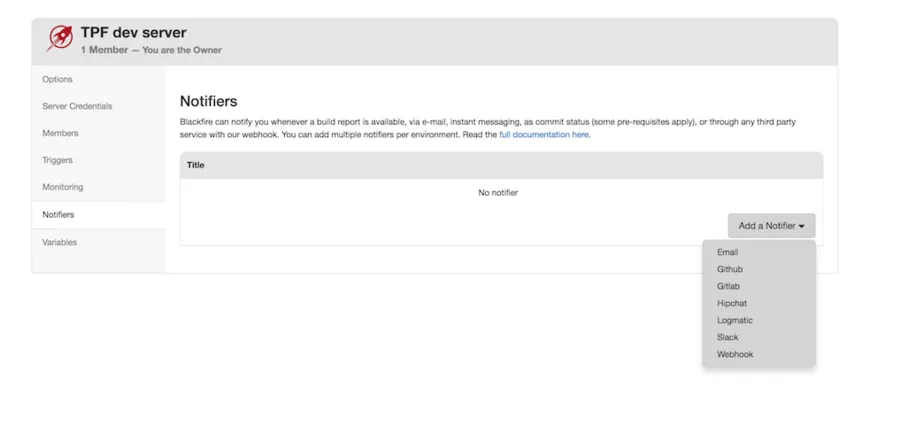
The last step is to get notified by email for the builds. For this, go to the environment settings, Notifiers and add an email notifier:
That's it! You should now get notified if a significant performance decrease happens on your project!
